

Gamification offers multiple benefits when it comes to user engagement. For newbie business owners, it can increase engagement metrics by 100-150%. Using gamification plugins can also easily boost social sharing and content discovery.
But have you ever thought about how gamification efforts work? If you run a WooCommerce store, adding points and badges isn’t enough. You need to track and analyze key metrics to ensure your gamification plugin delivers the desired results.
This blog post tells 7 crucial metrics you should monitor when using gamification plugins. By understanding these key metrics, you can:
- Measure the effectiveness of your gamification strategy,
- Identify areas for improvement
- Maximize user engagement
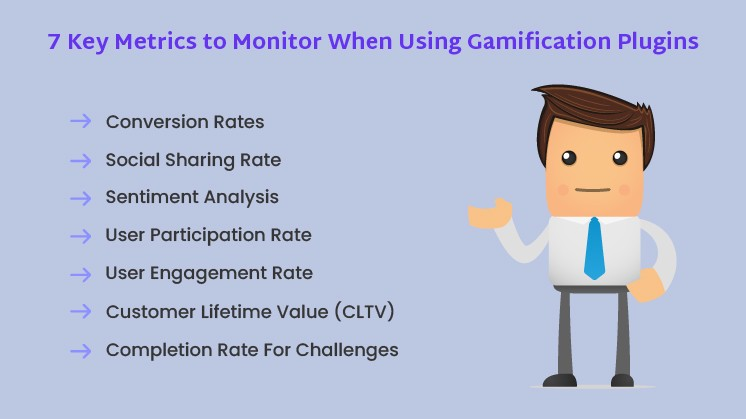
7 Engagement Metrics to Monitor Using Gamification Plugins
1. User Participation Rate
What it Measures:
This metric indicates the percentage of users actively participating in your gamification program. Participation can involve earning points, completing challenges, or unlocking badges.
Why it Matters:
A high participation rate signifies that users find your gamification elements engaging and motivating. A low participation rate suggests that the mechanics might be too complex, uninteresting, or incompatible with user behavior.
How to Track:
Divide the total number of users participating in your gamification program by the total number of users and multiply by 100 to get a percentage.
Example: If 1000 users and 200 actively participate in your gamification program, your participation rate is 20%.
Actionable Insights:
A low participation rate might indicate a need to simplify your gamification mechanics, offer more appealing rewards, or better integrate gamification elements with your overall user experience.
Analyze user behavior patterns to identify groups with low participation and customize your gamification strategies accordingly.
2. User Engagement Rate:

What it Measures:
This metric goes beyond simply participating. It measures how frequently users interact with your gamification elements over time. This could involve logging in daily to collect points, competing in challenges, or striving to climb the leaderboard.
Why it Matters:
A high engagement rate indicates that users are consistently motivated by your gamification program and find it valuable. This translates into longer user sessions, increased activity, and, potentially, higher conversion rates.
How to Track:
Monitor how often users earn points, complete challenges, or interact with other gamification features. Analyze the frequency of these actions over time to identify trends in user engagement.
Example: You might track that users collect points daily for the first week, but engagement drops significantly. This suggests introducing new challenges or rewards to maintain user interest.
Actionable Insights:
A declining engagement rate indicates the need to refresh your gamification strategy. Consider introducing new challenges, badges, or reward tiers to keep users motivated over time.
Track the specific actions users find most engaging and focus on optimizing those elements.
3. Conversion Rates:

What it Measures:
Conversion rate refers to the percentage of users who take a desired action after interacting with your gamification program. This action could be purchasing, signing up for a newsletter, or completing a desired task.
Why it Matters:
Ultimately, the goal of gamification is often to drive user behavior towards a specific action. Tracking conversion rates allows you to assess if your gamification strategy effectively influences user choices.
How to Track:
Analyze the percentage of users who perform a desired action (e.g., purchase) after participating in gamification activities compared to the total number of users who participated.
Example: You might track that 10% of users who complete a gamified tutorial go on to make a purchase, compared to a 5% conversion rate for users who don’t engage with the tutorial.
Actionable Insights:
A higher conversion rate for users who participate in gamification suggests your strategy successfully influences user behavior. Analyze the specific gamification elements that lead to conversions and focus on further amplifying those elements.
If the conversion rate is low, consider how your gamification program incentivizes the desired action. Are the rewards relevant and appealing to users?
4. Completion Rate for Challenges and Activities:

What it Measures:
This metric tracks the percentage of users who complete challenges or activities offered within your gamification plugin.
Why it Matters:
A high completion rate indicates that users find your challenges engaging and achievable. Low completion rates might suggest challenges are too difficult, uninteresting, or don’t provide enough value to users.
How to Track:
Divide the total number of users who complete a challenge or activity by the total number of users who started that challenge and multiply by 100 to get a percentage.
Example: If you offer a challenge to write 5 product reviews, and 100 users begin the challenge, but only 20 complete it, your completion rate is 20%.
Actionable Insights:
A low completion rate suggests a need to adjust your challenges. Make sure they are:
- Clear and well-defined: Users should understand what’s expected of them.
- Attainable: Challenges should be achievable but provide a sense of accomplishment.
- Aligned with user goals: Challenges should incentivize actions that benefit users and your business goals.
5. Social Sharing Rate

What it Measures:
This metric tracks how often users share their gamification achievements or progress on social media platforms.
Why it Matters:
Social sharing can significantly increase brand awareness and attract new users. It demonstrates the positive user experience you’re creating and encourages others to participate.
How to Track:
Monitor how often users share their points, badges, or leaderboard status on social media. Many gamification plugins offer built-in social sharing functionalities to track this data.
Example: You might track that users with high scores on your gamified quiz frequently share their results on Facebook, potentially attracting new users interested in taking the quiz.
Actionable Insights:
- Encourage social sharing by offering bonus points or badges for sharing achievements.
- Integrate social media sharing buttons seamlessly within your gamification elements.
- Make sure your gamification program offers achievements and rewards that users are proud to share publicly.
6. Sentiment Analysis

What it Measures:
This metric analyzes user feedback and online reviews to understand how users perceive your gamification plugin.
Why it Matters:
Understanding user sentiment allows you to identify areas for improvement and ensure your gamification experience is positive and engaging.
How to Track:
Use sentiment analysis tools to analyze user reviews, social media comments, and forum discussions to gauge user perception of your gamification plugin.
Example: Sentiment analysis may reveal user frustration with overly complex challenges or a lack of variety in reward options.
Actionable Insights:
- Pay close attention to negative feedback and address user concerns promptly.
- Analyze positive feedback to identify elements users find most engaging and build upon those successes.
- Conduct surveys or A/B testing to gather more specific user insights about using gamification plugins.
7. Customer Lifetime Value (CLTV)
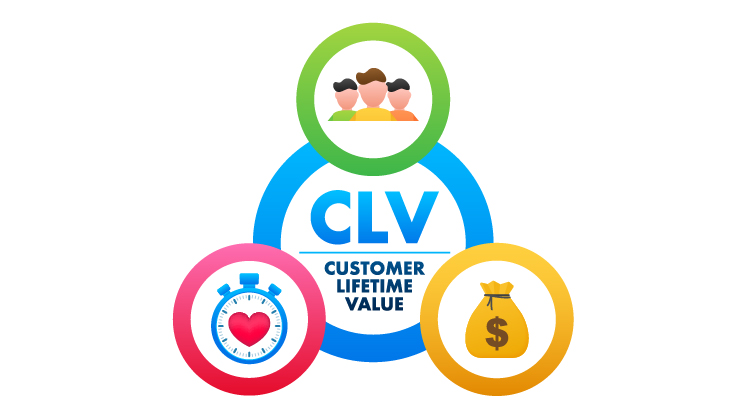
What it Measures:
CLTV refers to the total revenue a customer is expected to generate throughout their relationship with your business.
Why it Matters:
Gamification can significantly increase customer loyalty and engagement, potentially leading to a higher CLTV.
How to Track:
Calculating CLTV involves complex formulas that consider factors like average purchase value, purchase frequency, and customer churn rate. Several marketing analytics tools can help you estimate CLTV while using gamification plugins.
Example: You might track that users actively participating in your gamification program tend to make repeat purchases more frequently than non-participating users, indicating a potentially higher CLTV.
Actionable Insights:
Monitor the Customer LifeTime Value (CLTV) of users who engage with your gamification program compared to those who don’t. This can help assess the long-term impact of gamification on customer relationships.
Key Takeaways
- Refine your gamification mechanics: Ensure challenges are balanced, rewards are appealing, and the overall experience is motivating.
- Personalize the experience: Customize gamification elements to different user segments for a more engaging experience.
- Optimize for conversions: Align your gamification strategy with your business goals, encouraging users to take desired actions.
Wrap Up
By tracking and analyzing the above 7 key metrics, you can gain valuable insights into the effectiveness of using gamification plugins and user engagement. Remember, gamification is an ongoing process. By continuously monitoring and adapting based on data, you can ensure your gamification plugin remains a powerful tool for achieving your business objectives.
